

Enterprise Business Intelligence & Reporting Platform
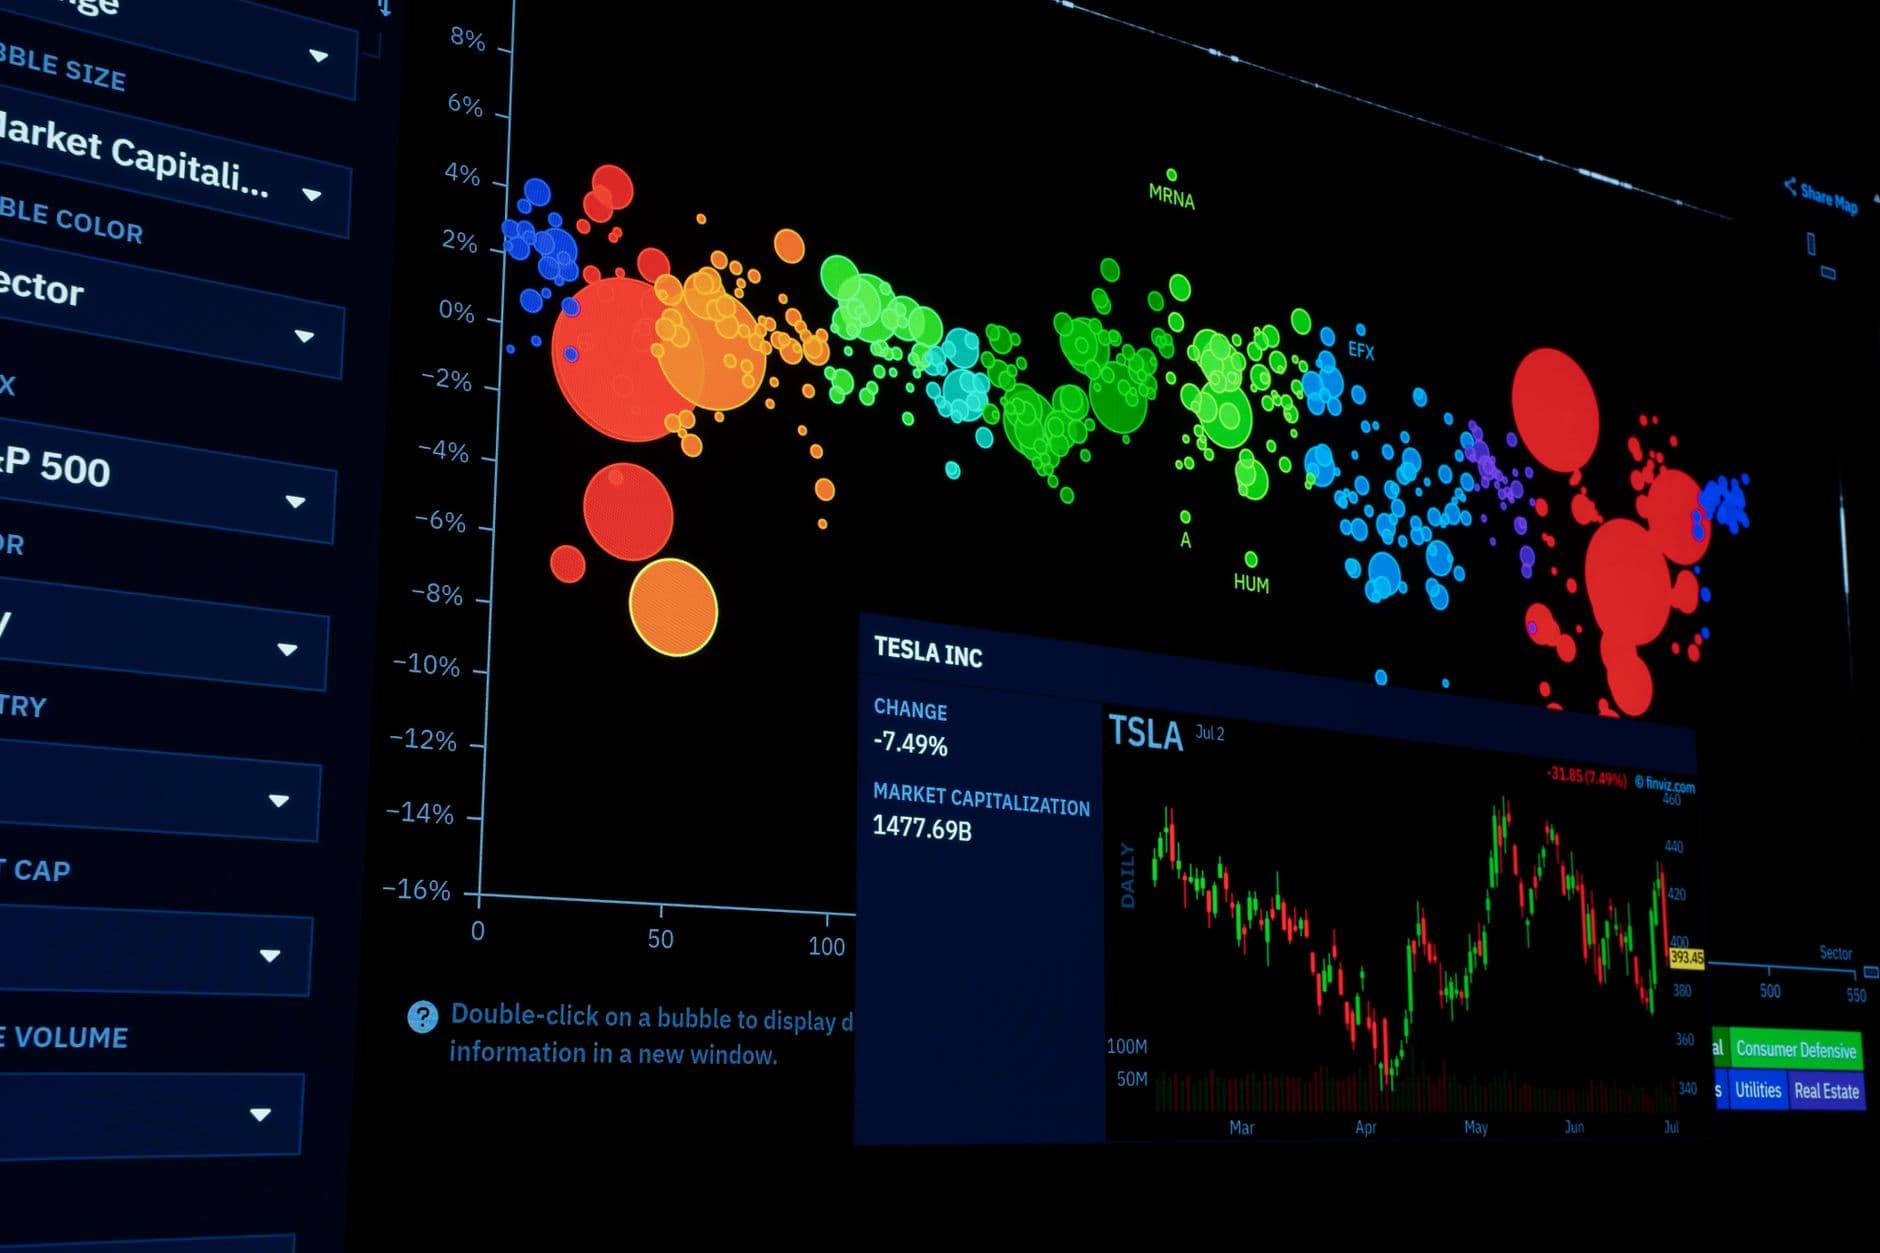
Built unified enterprise BI dashboards consolidating financial, operational, and sales metrics into a single reporting layer.
Reporting Time Saved
Reduction in manual data assembly time for executive leadership
Data Sources Unified
Centralized integration of ERP, CRM, billing, and web analytics
Dashboard Refresh
Automated incremental data updates every 15 minutes
The problem on the ground
Read the full brief
Executive leadership spent hours manually pulling reports from 8 different software platforms, leading to delayed decision making and conflicting metric calculations across departments.
How we engineered it
Read the approach
Designed a centralized PostgreSQL reporting schema transformed via Python ETL scripts into pre-aggregated data marts, powering executive Power BI and web dashboards.
What's running under the hood
See the execution breakdown
What changed for the client
See the outcomes
Technical Q&A
How does the BI platform maintain sub-second query performance?
Data is pre-aggregated into dimensional data marts on a read-replica database, ensuring complex analytical queries do not lock or slow down live production transactional tables.
Can business users create custom ad-hoc reports?
Yes, the platform exposes clean semantic models in Power BI and Metabase, allowing non-technical managers to build drag-and-drop custom reports safely.
Planning a similar analytics project?
Consult directly with our platform engineers to assess your workload and get a zero-downtime architecture plan.
